Peak Wavelengths vs. Spectrum Distribution: Understanding the Difference
Let’s take a moment to clarify something that often gets mixed up—probably because some companies don’t explain it as well as they should.
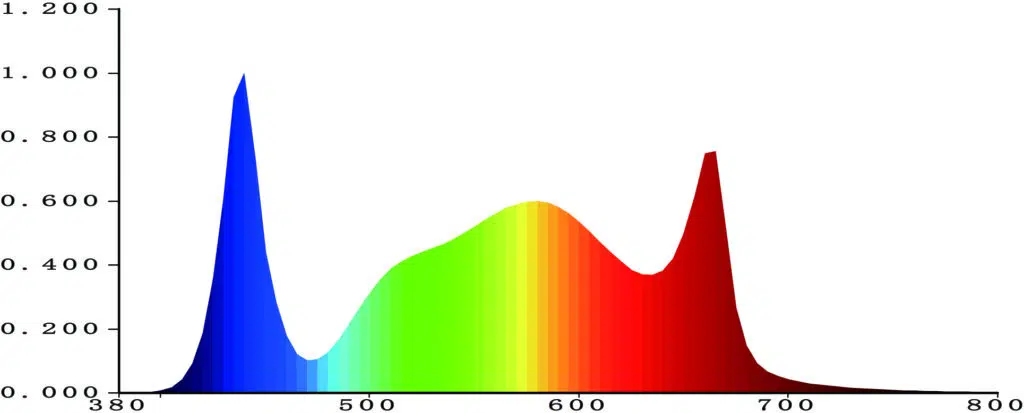
What the Chart Shows
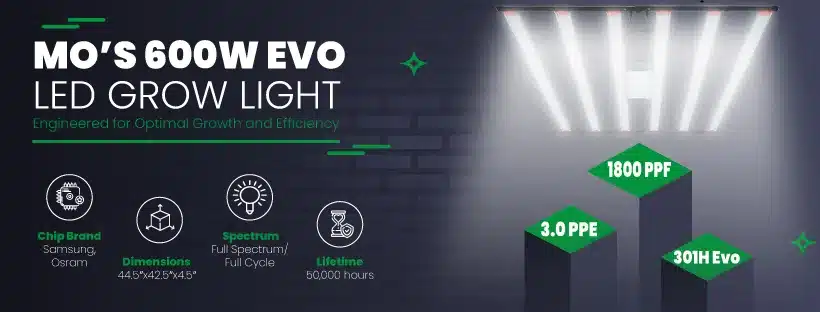
This chart highlights the relative intensity of your light across the visible spectrum. For instance, with our 600W Evo LED grow light (perfect for 4’x4′ tents, covering up to 25 square feet of flower coverage!), you’ll notice peaks at 437 nm (utilizing Samsung 301H Evo’s—unlike 301H, 301B, 301B Evo, 301D, 281B, 281B+, 3030, and 2835 LEDs which all have a 450 nm peak) in the blue spectrum and 660 nm in the red spectrum. These peaks are important because they show where the light is most intense at specific wavelengths, which are crucial for plant growth.
For a deeper dive into how different wavelengths affect plant development and what to consider when choosing the optimal grow light, check out our articles on What to Look for When Exploring the World of Grow Lights and Plant Pigments and Photoreceptors.
What the Chart Does Not Show
However, this chart is not the be-all and end-all. It doesn’t give you the full spectrum distribution. In other words, it won’t tell you exactly how much of each color is present in the light or how the light’s energy is spread across different wavelengths. This is where some confusion can creep in—understandably so.
For Spectrum Distribution
If you’re looking for a complete picture of the light’s spectrum distribution, you’ll need more detailed information, like the Total Photosynthetic Photon Flux (PPF) and how it’s distributed across various wavelength ranges:
- Total PPF (400-700 nm): 1877 μmol/s
- Blue PPF (400-500 nm): 380 μmol/s
- Green/Yellow PPF (500-600 nm): 788.3 μmol/s
- Red PPF (600-700 nm): 709 μmol/s
These figures provide the real breakdown of how the light is distributed across different parts of the spectrum, giving you a clearer understanding of how it will perform throughout your plant’s growth cycle.
So, next time you see one of these charts, remember: it’s showing you relative intensity, not the full spectrum distribution. And that’s an important distinction to make when evaluating any grow light.
Key Takeaways
- Spectrum Distribution vs. Peak Wavelengths: Understand the difference to make informed decisions about your grow light’s performance.
- Detailed Light Metrics: Ensure you have the complete picture with Total PPF and distribution across blue, green/yellow, and red wavelengths.
Curious to see how our 600W Evo LED Grow Light can boost your indoor garden? Learn more in our Education Center!


