How to Evaluate a Grow Light in 2026: PPFD, DLI, Spectrum, PPE, UV, Far Red, and the Marketing Tricks Nobody Talks About
The grow light industry has changed more in the last five years than it did in the previous twenty.
Today’s growers are flooded with claims of 3.0+ PPE efficiency, commercial-grade performance, revolutionary spectrums, integrated UV, far-red enhancement, smart controls, app integration, and coverage claims that often seem too good to be true.
Some of those claims are legitimate.
Many are not.
The challenge for modern growers is no longer finding a grow light. The challenge is understanding which specifications actually matter, which specifications are being manipulated for marketing purposes, and how to compare fixtures fairly.
This guide is designed to help you do exactly that.
PPFD: The Foundation of Indoor Cultivation
Photosynthetic Photon Flux Density, or PPFD, measures the number of photosynthetically active photons reaching a specific area every second.
Measured in μmol/m²/s, PPFD is one of the most important metrics in horticultural lighting because it directly reflects how much usable light reaches the canopy.
However, one of the biggest mistakes growers make is focusing entirely on peak PPFD.
Plants do not grow in a single point.
They grow across an entire canopy.
A fixture producing 1,900 PPFD in the center and 700 PPFD around the edges often performs worse in practice than a fixture producing a lower peak number with excellent uniformity across the entire footprint.
The goal is not maximum intensity in one spot.
The goal is maximum usable intensity across the entire cultivation area.
PPFD Without DLI Is Only Half the Story
PPFD tells you how much light plants receive at any given moment.
DLI, or Daily Light Integral, tells you how much light plants receive throughout an entire day.
This distinction is critical.
- 500 PPFD for 24 hours
- 1,000 PPFD for 12 hours
Both deliver roughly the same total daily photon load.
The plant does not only care about intensity. It also cares about duration.
This becomes especially important when growing autoflowers, day-neutral crops, leafy greens, herbs, and other plants capable of utilizing extended photoperiods.
Many growers chase PPFD while completely ignoring DLI.
The most successful growers understand both.
Why PPFD Maps Often Lie
One of the industry’s favorite marketing tricks is measuring fixtures inside empty reflective tents.
- Reflective walls
- Reflective floors
- No canopy
- No containers
- No irrigation systems
- No benches
- No plants
These conditions produce the highest possible numbers.
Unfortunately, they also produce some of the least realistic numbers.
Plants do not grow in empty tents. The moment containers, reservoirs, media, and canopy structure are introduced, the reflective environment changes dramatically.
When evaluating PPFD maps, demand more than a center number.
- Look for average PPFD.
- Look for edge and corner readings.
- Pay attention to the mapping environment.
- Compare flower coverage, not just veg coverage.
- Ask whether the map was taken in a tent, open room, or non-reflective test area.
A fixture that performs well in an open, non-reflective environment will generally perform exceptionally well in a tent.
The reverse is not always true.
Uniformity: The Most Underrated Metric
Uniformity determines how evenly photons are distributed across the canopy.
Poor uniformity creates uneven growth, uneven flower development, variable ripening, variable quality, and wasted photons.
For most applications, a center-to-edge reduction of roughly 10-20% is excellent, especially when mapped in an empty tent. If the map already looks bad in an empty reflective tent, it will usually look worse in a real grow or open-room environment.
The closer the edges are to the center values, the easier it becomes to maintain a consistent canopy and maximize productive square footage.
This is where fixture layout often matters more than raw output.
Small Spaces vs. Large Spaces
In smaller grow areas such as a 2×2, 2×4, 3×3, 3×5, 4×4, or 5×5, a single well-designed fixture can often provide the uniform PPFD needed for strong full-cycle growth.
But not all fixtures are designed well.
Some lights flood the center with photons while leaving the edges and corners weak. This may look good in a peak PPFD advertisement, but it leads to uneven plants and inconsistent production.
In larger areas such as a 4×8, 5×10, multi-table room, or open commercial space, fixture layout becomes just as important as fixture selection.
You cannot simply copy a tent layout and expect the same results in an open room. There are no reflective tent walls bouncing light back from all sides. Instead, you need to account for overlap, fixture spacing, edge losses, wall reflectivity, ceiling height, mounting height, and light bleed from adjacent fixtures.
Why a Light Meter Matters
If you are serious about maximizing your grow space, a light meter is one of the best tools you can own.
A meter allows you to measure actual PPFD in your real environment instead of relying only on manufacturer charts.
This lets you adjust fixture height, dimming, spacing, and layout to reduce hot spots and improve uniformity across the entire canopy.
Phone apps can be useful for rough estimates when properly calibrated, but a dedicated quantum PAR meter is still the better tool for growers who want more accurate measurements.
For hobby growers, affordable meters can often get close enough to be useful. For commercial growers, research facilities, or anyone pushing high PPFD environments, investing in a higher-quality meter with better accuracy, sensor quality, and warranty support is usually worth it.
Understanding PPE in 2026
Photosynthetic Photon Efficacy, or PPE, measures how efficiently a fixture converts electrical energy into photosynthetically active photons.
In simple terms, PPE tells you how many micromoles of PAR photons the fixture produces per joule of electricity consumed.
As of 2026, general fixture efficiency categories look something like this:
- Below 2.5 PPE: outdated
- 2.5-2.8 PPE: entry-level
- 2.8-3.0 PPE: good
- 3.0-3.1 PPE: premium
- 3.1-3.2+ PPE: cutting edge
Efficiency matters, especially when electricity costs are high or when operating multiple fixtures.
But PPE should never be viewed in isolation.
A fixture can achieve extremely high efficiency by manipulating spectral composition. The real question is not simply how efficient the fixture is.
The real question is how efficient it is given the spectrum being delivered.
Integrated Sphere Data vs. Marketing Fluff
Be careful with numbers that look too good to be true.
Many manufacturers advertise individual diode efficiency instead of complete fixture efficiency.
A diode may test extremely well by itself, but once it is installed into a fixture, driven at operating current, combined with other wavelengths, exposed to real thermal conditions, and powered by an actual driver, the total system efficiency changes.
That is why complete fixture testing matters.
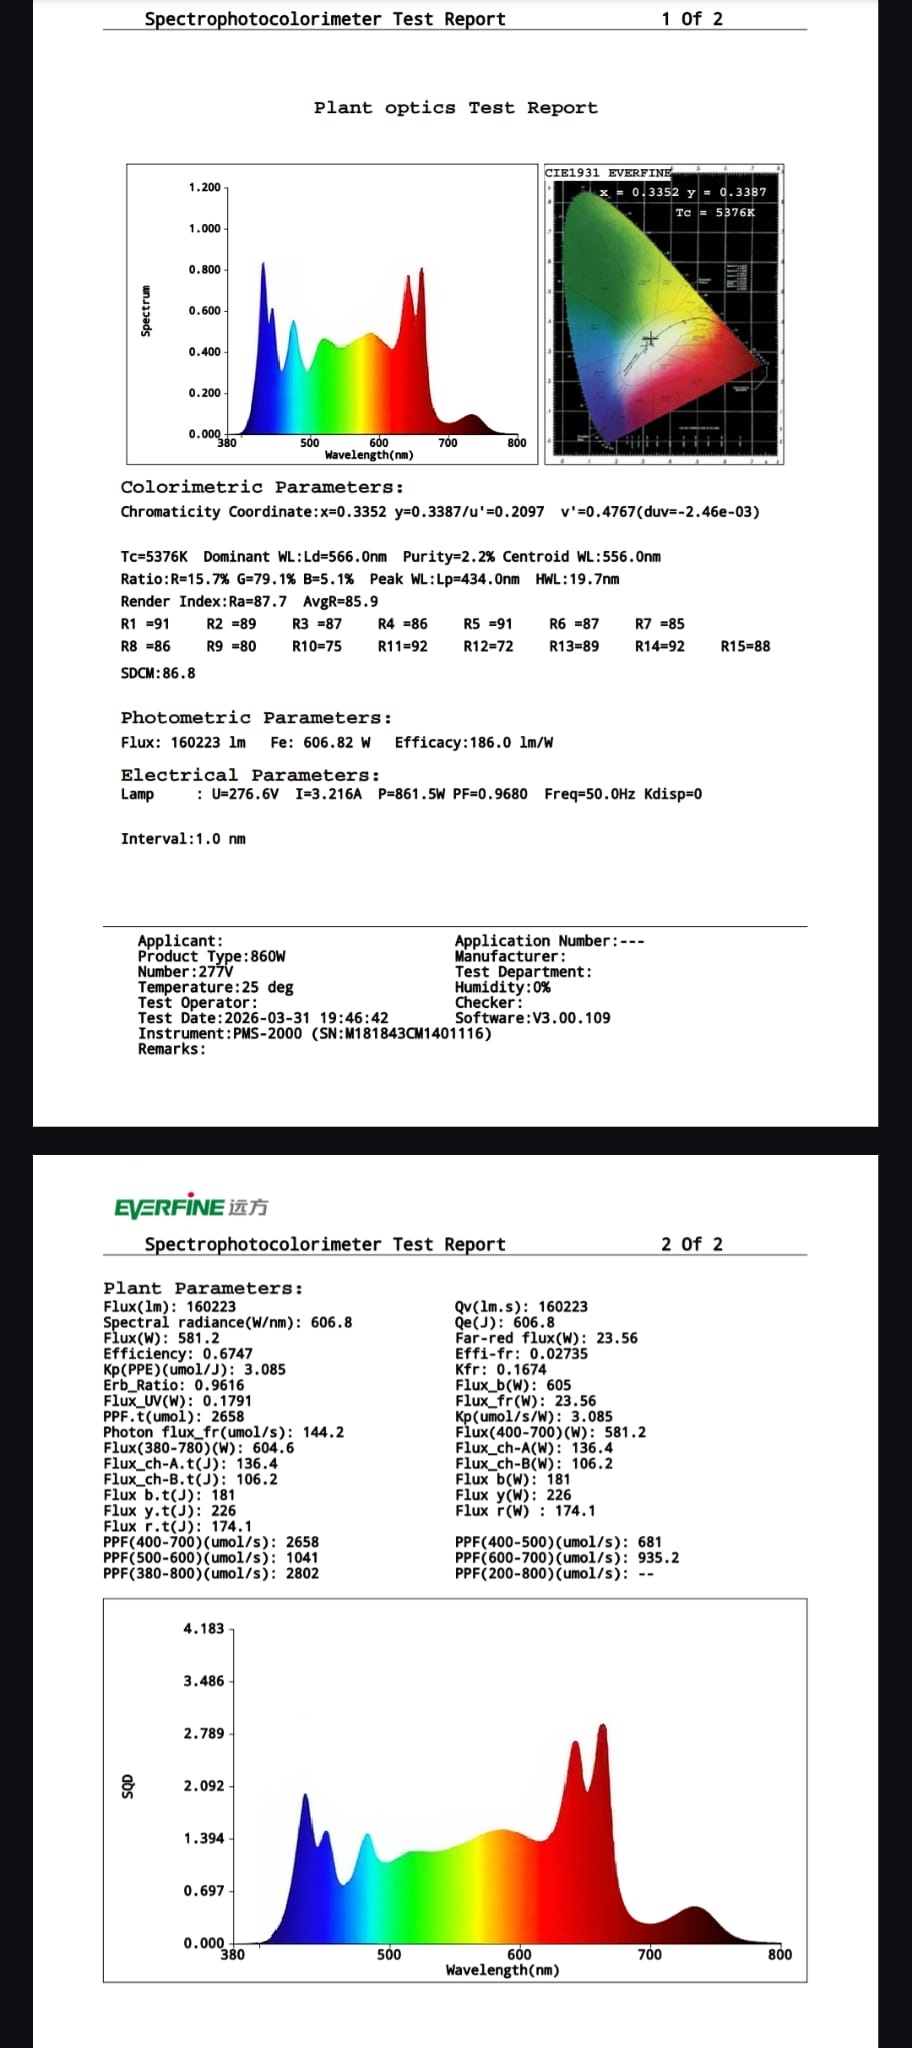
When comparing lights, look for:
- Total PPF
- Fixture-level PPE
- Input wattage
- Spectral distribution
- PPFD maps
- Test environment
- Integrated sphere or reputable third-party data
Do not compare a cherry-picked diode spec against a complete fixture spec. That is not an apples-to-apples comparison.
The PPE Arms Race
Modern horticultural lighting has entered a PPE arms race.
Red photons are among the most efficient photons to produce. As a result, many manufacturers have steadily increased red percentages while reducing overall spectral complexity.
The result is higher PPE numbers.
The downside is that plants respond to more than photosynthesis alone.
Light serves two purposes:
- Energy
- Information
Plants use light not only to drive photosynthesis, but also to regulate morphology, flowering responses, secondary metabolite production, pigment formation, photoreceptor signaling, and countless other biological processes.
The challenge is finding the balance between efficiency and spectral quality.
Stop Asking if a Light Is Full Spectrum
Ask how the spectrum was engineered.
“Full spectrum” has become one of the most abused phrases in horticultural lighting.
Almost every fixture on the market claims to be full spectrum.
The term has become nearly meaningless without spectral data.
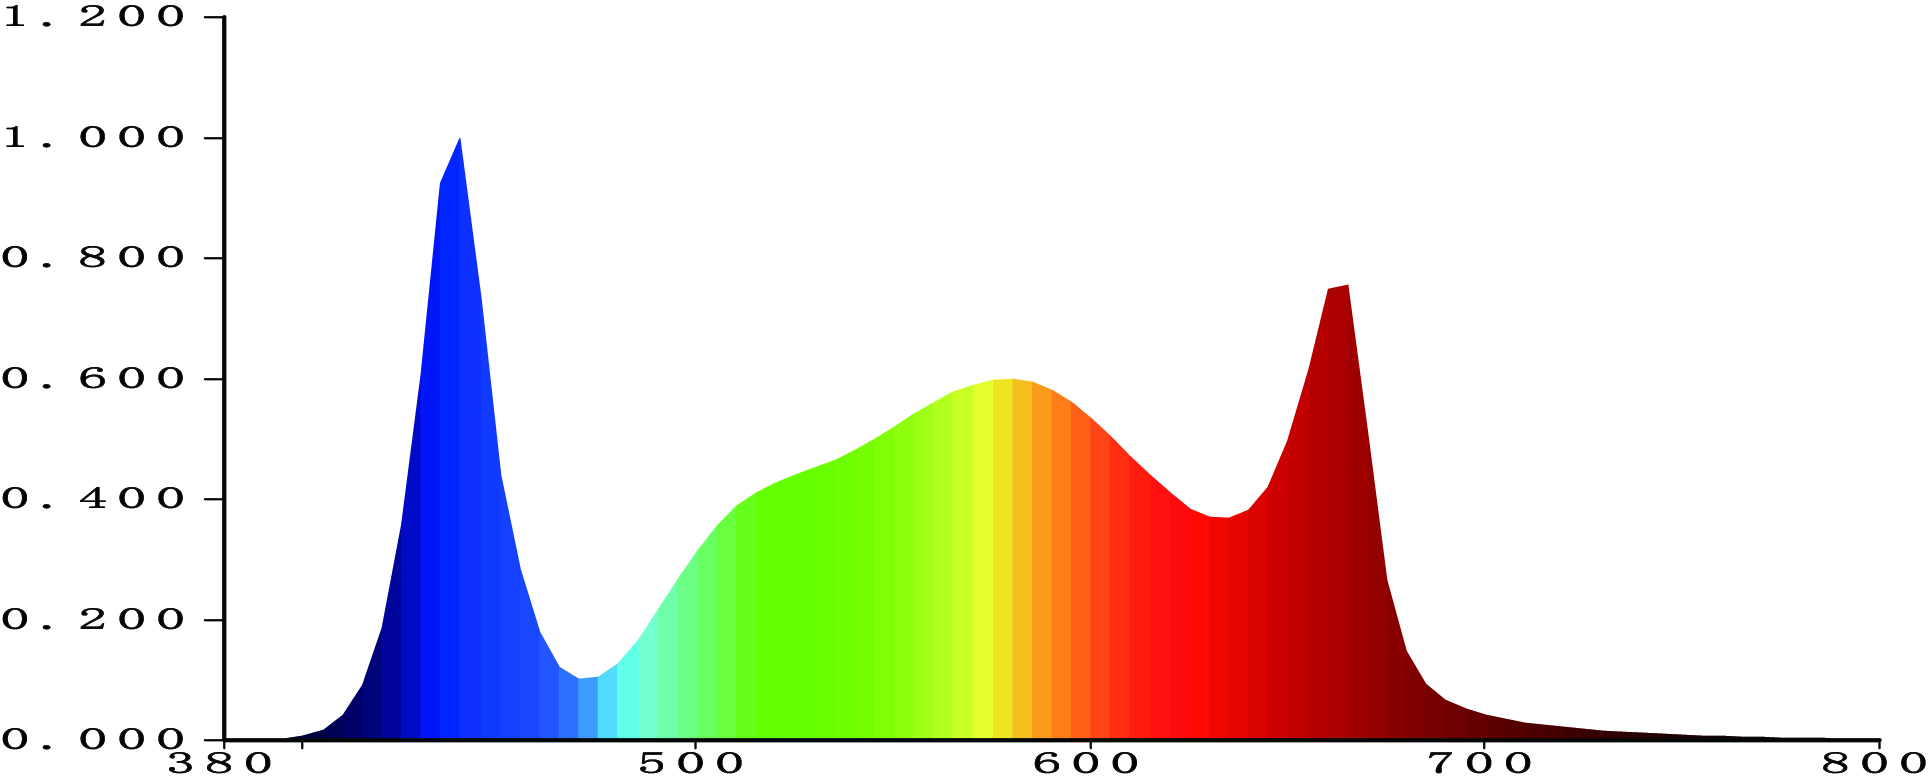
Instead, evaluate the actual spectral architecture:
- Blue architecture
- Cyan content
- Green content
- Red distribution
- Far-red strategy
- Spectral balance
- Overall spectral complexity
A modern horticultural fixture should be viewed as a spectral system, not just a light that happens to look white to the human eye.
Blue, Cyan, Green, Red, and Far Red
Blue light remains one of the most influential regions of the spectrum for controlling plant morphology and regulating numerous photoreceptor responses.
Green light, long underestimated by the industry, penetrates deeper into dense canopies than blue and red while contributing substantially to whole-canopy photosynthesis.
Cyan occupies an important position between blue and green and continues to receive attention for its role in broad-spectrum plant response and visual spectrum quality.
Red remains one of the most efficient regions for photosynthesis and is heavily used in modern grow light design.
Far red exists outside traditional 400-700nm PAR measurements, yet it plays an important role in phytochrome regulation and canopy signaling.
The best spectrums are rarely dominated by a single region.
The best spectrums are engineered for balance.
UV: Separating Science from Marketing
No topic in horticultural lighting generates more confusion than UV.
UVA is frequently marketed as a miracle wavelength.
The reality is considerably less exciting.
While UVA can influence certain plant responses, its contribution to photosynthesis is relatively minor compared to the core PAR spectrum. Many UVA claims are overstated, especially when only a small amount of UVA is included in the primary fixture.
UVB is different.
UVB can activate the UVR8 photoreceptor and trigger protective responses that may increase production of certain secondary metabolites, including terpenes and other defensive compounds.
The problem is implementation.
UVB LEDs remain expensive, inefficient, and short-lived compared to standard horticultural LEDs. For most growers, supplemental T8 or T12 UVB remains the more practical solution when UVB is desired.
UV should be treated as a tool, not a magic button.
Far Red: Useful When Used Correctly
Far red is neither magic nor useless.
It is simply another tool.
Used strategically, far red can influence flowering responses, shade responses, stretch behavior, canopy signaling, and phytochrome state.
Used improperly, it can contribute to excessive elongation and unwanted morphology.
Like UV, far red works best when used intentionally rather than indiscriminately.
Why Diode Density Matters
One of the most overlooked variables in fixture design is diode density.
Many manufacturers reduce diode counts to lower manufacturing costs and compensate by driving the remaining emitters harder.
Higher drive currents generally mean more heat, lower efficiency, faster degradation, greater spectral drift, and reduced long-term reliability.
Higher diode densities allow manufacturers to reduce drive current while maintaining output.
This often improves:
- Efficiency
- Thermal performance
- Reliability
- Spectral stability
- Long-term performance
Diode density is not simply a marketing number.
It is a legitimate engineering consideration.
Stop Obsessing Over Diode Brands
A decade ago, diode brand alone could often predict fixture quality.
That is no longer true.
Today, fixture performance is determined more by binning quality, thermal design, drive current, spectral engineering, optical efficiency, and mechanical design than by the name printed on the emitter itself.
A premium diode operated at excessive current and high temperature can underperform compared to a properly engineered fixture using competitively binned modern emitters.
The complete system matters more than any individual component.
Drivers, Cooling, and Serviceability
Drivers are the heart of an LED fixture.
Good drivers provide stable output, high efficiency, long life, reliable dimming, and controller compatibility.
Look for fixtures that use quality drivers and offer practical control options such as dimming, daisy chaining, controller compatibility, or 0-10V integration depending on your setup.
Cooling systems matter just as much.
Even the most efficient diode loses performance as temperatures rise. Thermal management affects efficiency, reliability, lifespan, and spectral stability.
Passive cooling systems are common in modern bar-style fixtures, but the quality of the heat sink, frame design, spacing, and airflow path still matter.
A fixture should not only perform well today.
It should perform well five years from now.
Warranties and Certifications
Performance matters, but so does confidence.
A quality fixture should be backed by a meaningful warranty, legitimate safety certifications, transparent specifications, and accessible customer support.
A 5-year warranty is common for serious horticultural fixtures, but the details matter.
Ask what the warranty actually covers.
- Does it cover LEDs?
- Does it cover drivers?
- Does it cover dimmers and controllers?
- Does it cover shipping?
- Are replacement parts available?
- Can the fixture be serviced?
Certifications such as UL, ETL, CE, FCC, RoHS, or DLC may also matter depending on your application, especially in commercial facilities, regulated spaces, or rebate programs.
For home growers, certifications may not be the only deciding factor, but they still provide useful information about safety and manufacturing standards.
Marketing Tricks to Watch For
The grow light market is full of claims that sound impressive but do not always translate into real-world performance.
Be careful with:
- HPS equivalent wattage claims
- Veg coverage advertised as flower coverage
- Peak PPFD advertised without average PPFD
- Empty tent maps presented as real-world performance
- Individual diode efficiency presented as fixture efficiency
- Vague “full spectrum” claims without spectral data
- UV and far-red claims without actual output information
- App features used to distract from weak core performance
- Huge diode counts without discussing quality, current, or output
The best way to protect yourself is to compare complete fixture data, not marketing language.
Core Specs That Actually Matter
When evaluating a grow light, focus on the complete system.
- Actual wattage
- Total PPF
- Fixture-level PPE
- PPFD maps
- Average PPFD
- Uniformity
- Flower coverage
- Spectral distribution
- Diode density
- Drive current
- Thermal design
- Driver quality
- Control compatibility
- Warranty
- Serviceability
No single specification tells the whole story.
The best fixtures are the result of intelligent engineering that balances efficiency, spectrum, uniformity, reliability, thermal performance, and long-term durability.
The Bottom Line
The best grow light is never defined by one number.
Not PPFD.
Not PPE.
Not diode count.
Not spectrum.
Not price.
The best grow lights are complete systems designed around how plants actually use light.
Ignore the hype.
Understand the data.
And remember:
Plants don’t read specification sheets.
They respond to light.